You are wasting countless hours copying and pasting stack traces from your browser to your AI assistant. The traditional feedback loop seeing a bug, inspecting the DOM, grabbing the console output, and feeding it to an LLM is broken and highly inefficient.
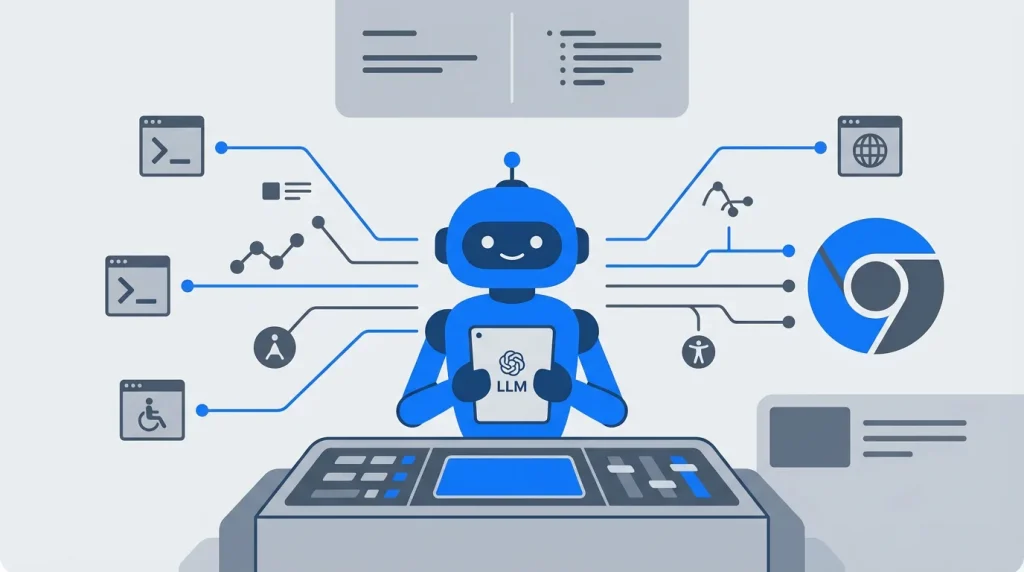
We are officially transitioning from passive code generation to autonomous agentic workflows. The Model Context Protocol (MCP) standardizes how Large Language Models (LLMs) connect to external data sources. Google’s official chrome-devtools-mcp server just eliminated the barrier between your AI assistant and your live application.
This tool transforms your AI from a static code generator into an active participant capable of executing, debugging, and verifying software autonomously.
The Architectural Bridge: Connecting MCP to CDP
To grasp the magnitude of AI-driven debugging, you must first understand the underlying infrastructure. The Chrome DevTools Protocol (CDP) is the backbone of modern browser debugging. It provides the low-level API necessary for inspecting, profiling, and manipulating Chromium-based browsers.
Whenever you open the Inspect Element panel, or run an automated test using Puppeteer or Playwright, you are interacting with CDP. The protocol operates over WebSockets, exchanging asynchronous JSON-RPC messages between the client and the browser runtime.
The chrome-devtools-mcp server acts as a specialized translation layer. It wraps complex CDP commands into clean, MCP-compliant tool definitions. Instead of forcing an LLM to generate raw WebSocket messages, the server exposes standardized functions.
When an AI agent like Claude Code or Cursor needs to investigate a misaligned container, it issues a simple API call. The MCP server queries the live browser instance and returns the exact DOM structure, CSS computed values, or network payload. The agent reads the live state, writes the fix, and verifies the visual output without you ever touching the mouse.
Bypassing Infrastructure Bottlenecks
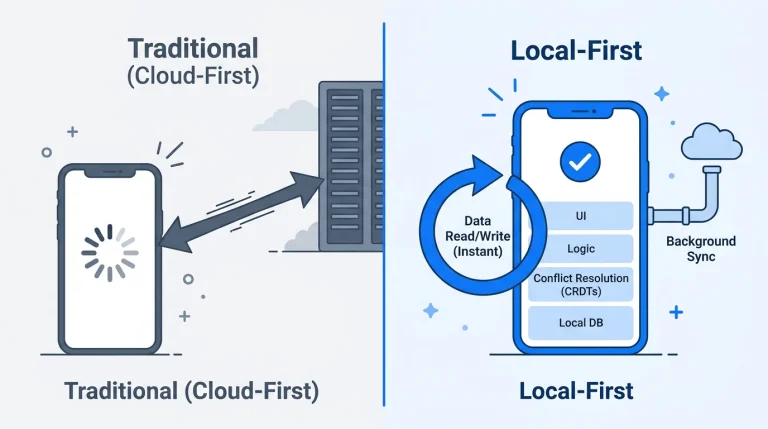
Architecting a modern application involves navigating massive time-sinks. Building robust local-first syncing, managing complex state updates, and implementing Conflict-Free Replicated Data Types (CRDTs) burn hundreds of engineering hours. You should be shipping features, not wrestling with foundational boilerplate.
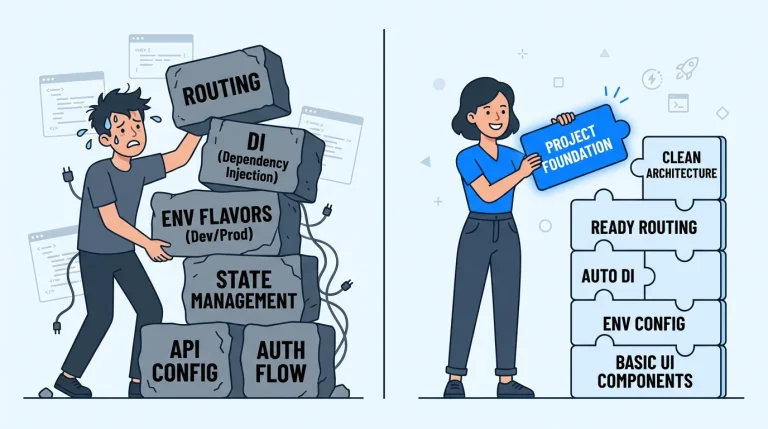
This is the exact problem we solve at Stacklyn Labs. Our premium software studio provides production-ready Flutter templates, SaaS-in-a-Box bundles, and battle-tested offline-first mobile architectures.
By utilizing our feature-first templates, development teams and agencies bypass these infrastructure headaches entirely. You can cut months off your development timeline and focus strictly on unique business logic. Paired with AI-driven debugging tools like the DevTools MCP server, your team can achieve unprecedented velocity.
Core Capabilities: Giving AI Eyes and Hands
Google engineered the official MCP server to expose the most powerful aspects of the browser engine. The implementation provides a suite of targeted tools that give AI agents complete autonomy within the execution environment.
Here is how the foundational capabilities change the development lifecycle:
1. Live DOM Inspection and Manipulation
Static HTML scraping fails when dealing with modern Single Page Applications (SPAs) or frameworks like Flutter Web. The get_dom_snapshot tool retrieves a comprehensive, fully rendered view of the document object model.
This snapshot includes the dynamic state of elements, encapsulated Shadow DOMs, and the complete accessibility tree. An agent can analyze the live layout tree to understand exactly how the browser painted the UI. Furthermore, the LLM can execute commands to dynamically alter CSS attributes or inject styles, testing layout hypotheses in real-time before committing code to your repository.
2. Arbitrary JavaScript Execution
Debugging stateful frontend applications often requires interacting with the runtime environment directly. The evaluate_javascript tool allows the AI to run arbitrary scripts within the page’s current execution context.
This capability is essential for inspecting the internal state of frameworks like React, Vue, or Angular. If an agent needs to verify a global variable or trigger a highly specific UI event, it can construct the payload and execute it natively. This turns the AI into an active participant capable of prodding the application state to isolate edge-case bugs.
3. Network and Console Monitoring
Network blindspots are a primary cause of wasted debugging time. The MCP server enables continuous streaming of console logs and network activity directly to the agent.
Imagine you tell your AI assistant, “Fix the authentication failure on the staging environment.” The agent monitors the network tab, captures a 401 Unauthorized response, and inspects the raw request headers. It can immediately identify a missing JWT token or a malformed CORS header, locate the offending interceptor in your source code, and patch it immediately.
4. Visual Verification via Multimodal Models
Text-based debugging has limits when dealing with visual regressions. The server supports capturing high-fidelity screenshots of the active viewport or specific, isolated DOM elements.
This provides the LLM with direct visual context. As multimodal models like Claude 3.5 Sonnet and GPT-4o advance, their ability to interpret complex layouts improves exponentially. The agent can take a snapshot, identify that a modal is clipping off the screen, adjust the z-index or flexbox constraints via CDP, take another snapshot, and verify the visual fix.
Transforming the Developer Workflow
The integration of browser telemetry with agentic workflows fundamentally rewrites how engineering teams handle maintenance and quality assurance. We are moving away from manual, step-by-step investigation toward intent-driven development.
Autonomous Bug Resolution
In a standard workflow, diagnosing a broken checkout flow requires massive context switching. You observe the error, open the DevTools, hunt for the stack trace, switch back to your IDE, modify the code, and refresh.
With the MCP server, you simply assign the objective. The agent programmatically inspects the disabled button, traces the attached event listeners, identifies the failing validation logic, and rewrites the source file. The AI handles the investigation; you handle the architectural review.
Deep Accessibility and Performance Audits
Static analysis tools only catch surface-level accessibility violations. By accessing the live accessibility tree via MCP, agents perform dynamic audits. They can programmatically tab through the interface, verify focus trapping in modals, and ensure ARIA labels update correctly during state changes.
Similarly, agents can extract low-level performance metrics directly from the browser engine. They can analyze Core Web Vitals, identify render-blocking resources, and suggest specific architectural optimizations to improve Largest Contentful Paint (LCP) times.
Intelligent Test Generation
Writing and maintaining brittle end-to-end tests in Playwright or Cypress is a notoriously high-friction task. Instead of manually mapping out CSS selectors, developers can instruct an AI agent to execute a specific user journey.
The agent utilizes the MCP server to walk through the interface, recording the exact, resilient selectors and interaction patterns required. It then synthesizes a robust, production-ready test suite automatically. This shifts the engineering burden from test implementation to test strategy.
Implementation and Security Architecture
Integrating the chrome-devtools-mcp server requires specific environmental configurations. You must run the server locally and connect it to a running Chrome instance initialized with the --remote-debugging-port=9222 flag. This exposes the WebSocket debugger URL that the MCP server binds to.
Security must remain your top priority when granting an LLM programmatic access to a live browser. The MCP server operates entirely on your local machine, ensuring that sensitive DOM snapshots and network logs are not broadcast to third-party telemtry services.
However, you must exercise strict caution when allowing AI agents to interact with active browser sessions. An autonomous agent with full CDP access can easily scrape authentication cookies, read sensitive personal data, or execute destructive actions on logged-in production accounts. Google engineers and the MCP community strongly mandate using isolated, dedicated browser profiles or strictly enforced Incognito sessions for AI-driven debugging. This isolates your personal credentials and mitigates the risk of automated data exfiltration.
The Engineering Takeaway
Google’s release of the official Chrome DevTools MCP server is a definitive statement about the trajectory of software engineering. The browser the absolute source of truth for modern applications is now fully exposed to AI agents. The artificial separation between the environment where you write code and the environment where you execute code is gone. Prepare your team to stop managing boilerplate code and start directing autonomous systems.
References & Further Reading
- Model Context Protocol (MCP) Official Documentation
- Google Chrome DevTools Protocol (CDP) Documentation
- Anthropic’s Claude Code Documentation
- Official MCP Servers GitHub Repository
Stacklyn Labs
Developer Notes & Updates