The evolution of the Go programming language (Golang) has been defined by a singular philosophy: simplicity over complexity. However, for the modern engineer, simplicity in language syntax must be matched by robustness in the development lifecycle. While the Go compiler is famously fast, the true productivity gains in the ecosystem come from a specialized suite of tools designed to handle static analysis, debugging, and performance profiling.
In this technical deep dive, we explore the essential developer tools that bridge the gap between writing code and shipping high-performance, production-ready Go applications.
The Foundation: The Go Toolchain and the Zero-Configuration Philosophy
Unlike many ecosystems that rely on fragmented third-party build systems, Go provides a comprehensive standard toolchain. This batteries-included approach minimizes tooling fatigue.
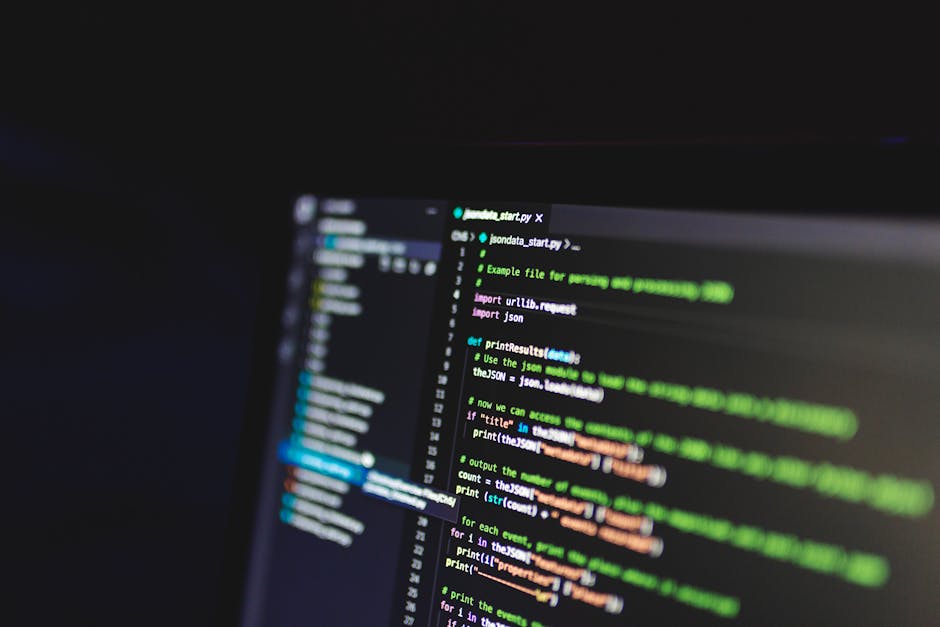
The core of this is the go command itself. Beyond go build and go run, the toolchain includes go fmt, which enforces a canonical coding style. By eliminating debates over brace placement or indentation, go fmt allows teams to focus entirely on logic. Furthermore, go mod has matured into a world-class dependency management system, utilizing a go.sum file to ensure cryptographic checksums for all dependencies, thereby securing the supply chain.
For static analysis, go vet is the first line of defense. It examines source code and reports suspicious constructs, such as Printf calls whose arguments do not align with the format string or unclosed HTTP response bodies. While go vet is conservative, it is highly accurate, making it a mandatory step in any modern CI/CD pipeline.
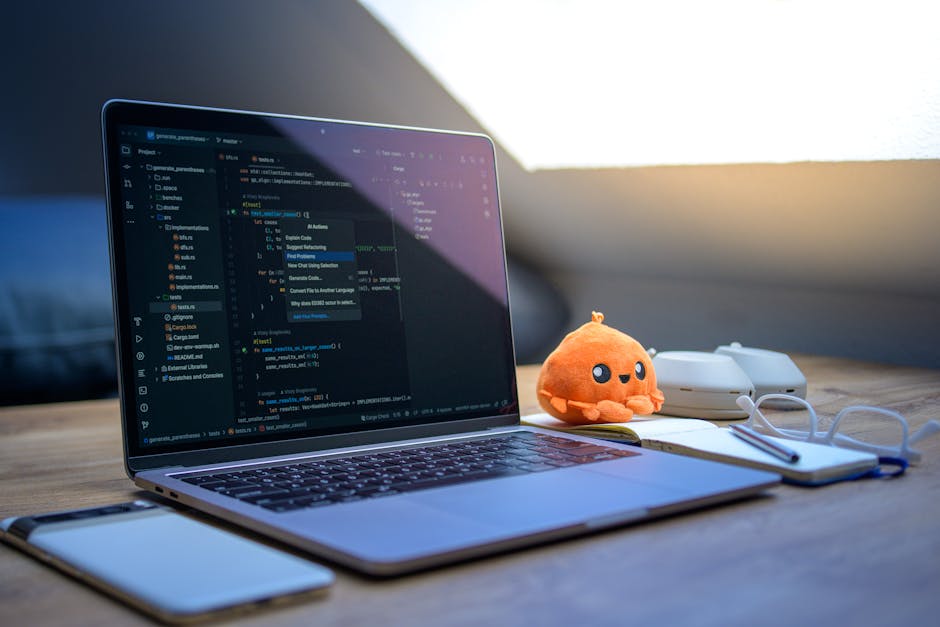
The Intelligence Layer: gopls and the Language Server Protocol
The rise of the Language Server Protocol (LSP) revolutionized Go development. At the heart of this revolution is gopls (pronounced go-please), the official Go language server maintained by the Google team.
gopls provides the IDE-like features autocompletion, go-to-definition, find-references, and symbol search regardless of whether the engineer uses VS Code, Vim, or Emacs. Technically, gopls works by parsing the source code into an Abstract Syntax Tree (AST) and Type Checking it in real-time. Because it is deeply integrated with the Go compiler's own logic, it offers a level of accuracy that previous tools like go-outline or gocode could not match. It also supports complex refactoring, such as renaming identifiers across an entire module, which is a critical productivity booster for large-scale refactors.
Advanced Debugging with Delve
When logic fails, engineers turn to Delve (dlv). While traditional debuggers like GDB can be used with Go, they are often inadequate because they do not understand Go’s runtime primitives, such as goroutines and segmented stacks.
Delve is designed specifically for Go. It allows engineers to inspect the state of a program by interacting with the Go Runtime’s scheduler. A senior engineer can use Delve to list all running goroutines, switch between their contexts, and inspect local variables that might be optimized away in other debuggers.
One of Delve's most powerful features is headless debugging. By running a Delve server inside a Docker container or a remote staging environment, developers can attach their local IDE to the remote process. This allows for debugging production-only bugs in a controlled environment without the friction of disparate file paths.
Enforcing Quality: golangci-lint
While go vet is a great start, professional-grade Go projects require more rigorous checks. This is where golangci-lint has become the industry standard. It is not a linter itself, but rather a runner that aggregates dozens of different linters (such as unused, errcheck, and staticcheck) and runs them in parallel.
The primary advantage of golangci-lint is its performance. By reusing the same AST and type-checking data across multiple linters, it reduces execution time significantly compared to running each linter sequentially. It also supports a configuration-based approach via a .golangci.yml file, allowing teams to toggle specific rules, set complexity thresholds (e.g., cyclomatic complexity), and enforce documentation standards. This ensures that the codebase remains idiomatic and maintainable as the team scales.
Performance Engineering: pprof and Trace
Go’s claim to fame is its performance, but achieving high throughput requires visibility into bottlenecks. The pprof tool is the standard for profiling CPU usage, memory allocation (heap), and blocking profiles.
By importing net/http/pprof, developers can expose a profiling endpoint on a running service. Using go tool pprof, an engineer can visualize the hot paths of an application via flame graphs. This is often the only way to identify GC pressure situations where the garbage collector is working too hard due to excessive short-lived object allocations.
For even deeper analysis, the go tool trace provides a view into the runtime scheduler. It shows exactly when goroutines are created, when they are blocked by the network or a mutex, and how they are distributed across OS threads. This level of granularity is essential for optimizing highly concurrent systems where contention, rather than raw CPU speed, is the bottleneck.
Modern Testing: Fuzzing and the Race Detector
Finally, productivity is measured by the absence of regressions. Go 1.18 introduced native support for Fuzzing. Unlike traditional unit tests that use static inputs, the go test -fuzz command generates random data to find edge cases that might cause crashes or security vulnerabilities.
Complementing this is the Race Detector (-race flag). Since Go encourages concurrency, data races are a common pitfall. The race detector is a powerful instrumentation tool that identifies unsynchronized access to shared memory. While it incurs a performance overhead and is typically only used in testing or canary environments, it is an indispensable tool for ensuring the thread-safety of high-concurrency applications.
Conclusion
The modern Go engineer’s productivity is no longer tied to manual overhead but to the mastery of this integrated ecosystem. By leveraging gopls for development, golangci-lint for quality, Delve for debugging, and pprof for optimization, engineers can move from prototype to production with a degree of confidence and speed that few other languages can match. The toolchain is not just a utility; it is the physical embodiment of Go’s commitment to engineering excellence.
Author: Stacklyn Labs